

Women Didn't Win—Men Left the Workforce
Korea is already living through the next chapter of America's shifting labor market dynamics.
Opening
Last week, news broke from the United States that two lines had crossed. American women now hold 176,000 more payroll jobs1 than men. According to July data from the Bureau of Labor Statistics (BLS), women held 79,517,000 jobs, accounting for 50.1% of the total. It is only the third time in US history this has happened.
Reader, I looked at this headline from a slightly different angle. The two lines did not meet because the line for women rose to meet the other. They met because the line for men fell.
Here is the bottom line: this is not a story about who won. It is a story about two groups being displaced at entirely different points in the economy. And South Korea has already been playing out the next scene of this graph for the past 10 years.
First, Let’s Question This Number
As soon as I read the report, the first thing I checked was the scale of that 176,000 figure. With total payroll jobs standing around 159 million, 176,000 represents barely 0.1% of the total—a razor-thin margin of 79,517,000 women against roughly 79.34 million men.
Moreover, on August 28, the BLS will release its preliminary benchmark revision for March2. This revision typically shifts employment levels up or down by hundreds of thousands of jobs. In other words, the much-discussed reversal could survive the revision intact, or it could quietly vanish inside the margin of error. It is simply too early to treat this “crossover” as an established fact.
Historical precedent warrants similar caution. The same shift occurred twice before: once during the Great Recession between 2009 and 2010, and again in November 2019 when women briefly reached 50.1% of payrolls. Both times, the trend reversed. In the first instance, recession hit male-dominated manufacturing and construction first; in the second, the pandemic dealt an immediate blow to female-dominated retail and hospitality. Both were temporary crossovers driven by cyclical economic shocks.
There is only one reason analysts argue this time is different: it happened without a recession. Laura Ullrich, director of economic research at Indeed Hiring Lab, notes that the current shift does not match previous recessionary patterns. In her view, this looks less like a temporary dip and more like a semi-permanent structural shift driven by long-term declines.
What, then, is the real signal? I believe it lies not in the crossover itself, but in three underlying numbers:
- Over the past 12 months, men lost a net 142,000 jobs, while women gained 298,000.
- Of the 1.2 million jobs added between February 2024 and February 2026, roughly two-thirds went to women.
- Since statistical tracking began in 1948, the labor force participation rate3 for American men has dropped roughly 20 percentage points, from 86.7% to 67.2%. Over the same period, women’s participation rose from 32% to 57.2%.
That last line is the core issue. While women climbed by 25 percentage points, men fell by 20 percentage points. The meeting of these two lines cannot be explained by one side’s rise alone.
But “Women Won” Isn’t True Either
The way this news is being consumed worries me. The moment the 50.1% figure is framed as a victory for women, all that remains is mutual resentment.
50.1% is simply a count of jobs. It does not reflect wages, seniority, or wealth. According to an analysis by the Korean Women’s Development Institute (KWDI), Korean women’s average monthly wages are 29.0% lower than men’s—the widest gender pay gap among OECD member countries. In fact, South Korea has held the top spot virtually every year since the OECD began tracking the metric.
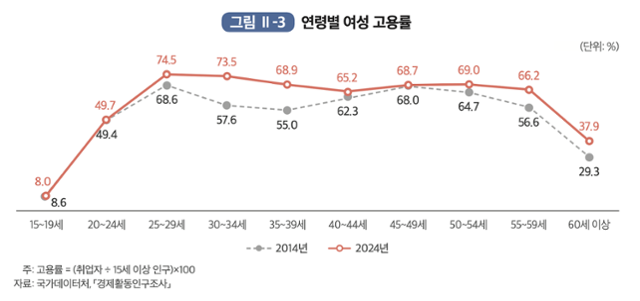
Female employment rate by age group in 2024. White Paper on Women’s Economic Activity
The flattening of Korea’s M-curve4 tells the same story. Looking strictly at the numbers, things have clearly improved. In 2025, the employment rate for women aged 30–34 hit an all-time high of 73.5%, while the rate for ages 35–39 climbed to 68.9%. For women aged 15–64, employment reached 62.1%, the highest since records began.
Yet much of this flattening is the byproduct of a growing unmarried population and higher educational attainment. Put bluntly, there are more cases where careers were never interrupted in the first place because the disruption never occurred. In a country with a total fertility rate of 0.75, a flatter M-curve can hardly be read as a sign that structural discrimination has dissolved. Furthermore, analysts consistently point out that the quality of jobs for women in their 40s and 50s—the upward rebound of the curve—is far more precarious than what they had in their 20s and 30s.
To put it plainly: the line for women has certainly climbed, but where it has landed is no victory.
South Korea Crossed This Line a Decade Ago
This is where this news stopped feeling like someone else’s story to me.
South Korea has already lived through what the United States witnessed for the first time this month. The point where the female employment rate in the 25–29 age bracket overtook that of men arrived back in 2016. And it never reversed. As of 2025, the female employment rate for this age group stands at 74.5%, maintaining the gap.
You cannot place the two metrics strictly side by side, since the American crossover reflects total payroll employment while the South Korean data looks at employment rates within a specific cohort. Yet the underlying trajectory is identical: the dynamic flips among the youth first, and that flip does not roll back. South Korea already possesses a full 10 years of data on what comes after.
That leads to the truly interesting question: what happens once the crossover occurs? South Korea’s answer is clear. Neither side has had it any easier.
Pushed Out in Different Ways
South Korea’s youth employment indicators are currently quite alarming. As of July 2026, the youth employment rate has fallen for 27 consecutive months, and the total number of employed youth has contracted for 45 straight months. In June alone, employment among those in their 20s dropped by 199,000. The extended unemployment rate5—which includes job seekers and discouraged workers—remains stuck in the 16% range. That means more than 1 in every 6 young people is effectively unemployed or underemployed.
Which sectors saw these declines? Manufacturing has shrunk for 24 consecutive months, losing 97,000 jobs in June alone, while construction fell for 25 straight months, shedding 67,000 workers. By contrast, health and social welfare services expanded by 214,000 jobs in the same month, and the number of employed workers aged 60 and older jumped by 211,000, propping up the overall employment headline figures.

We see the same pattern among youth classified as swieosseum6 (literally “just resting”)—those who report that they are neither working nor looking for work. In an analysis by the Korea Employment Information Service, men made up 55.8% of this group.
The structural dynamic in the United States is identical. Ullrich pointed to the contraction of tech and financial services jobs—sectors where men predominate—as a key reason virtually all US job gains over the past year went to women.
This is not a story about men deciding to drop out of work. It is a story about industries heavily populated by men halting their hiring, while expanding roles are concentrated in female-majority sectors. Gendered employment statistics are less an index of gender dynamics than a lagging indicator of industrial restructuring.
And the sense of deprivation created by this structure is real. The problem lies in how that deprivation is being translated.
The Stat Used to Scold Them Was Distorted from the Start
There is a line that appears in almost every article on this topic: a study supposedly found that young men spend about 70% of their non-working hours on video games and recreational computing. You can easily imagine how this line gets weaponized—over drinks, in corporate meeting rooms, or around the family dinner table on holidays.
So I went back and read the original paper. It was published in 2021 in the Journal of Political Economy by Mark Aguiar, Mark Bils, Kerwin Kofi Charles, and Erik Hurst. Here is what the paper actually says.
Since 2004, men aged 21 to 30 have shifted a substantial share of their leisure time toward gaming and recreational computing, and their work hours declined by more than those of older men or women over the same period. The researchers estimated that improvements in leisure technology explain roughly half of the increase in leisure time, calculating the resulting decline in hours worked at between 1.5% and 3.0%. This corresponds to 38% to 79% of the differential decline in work hours when compared to older men.
This is a conditional estimate spanning a wide interval that more than doubles from low to high. That is a completely different story from the claim that “70% of non-working time is spent gaming.”
The paper even includes a revealing footnote. In the American Time Use Survey, the “gaming” category lumps video games together with card games and board games like Scrabble, making them indistinguishable. The authors explicitly noted that what they captured might just as well have been a Scrabble boom rather than a video game boom. It was an honest acknowledgment by scholars of the limitations of their data, but as the paper circulated in popular media, the footnote vanished and the number only grew.
A conditional estimate meant to explain causes was turned into a basis for passing judgment on people.
Oswarld’s Lens
In my consulting work, the most common failure pattern I see is misattributing cause. When stepping into a company facing declining revenue, leadership almost invariably points fingers at the sales team’s work ethic first. Someone in the boardroom inevitably grumbles that “younger people just lack hunger these days.” Yet dig into the data, and the culprit is almost always channel strategy, pricing architecture, or product lifecycle decline. Blaming attitude is convenient for a simple reason: fixing structural problems is difficult and expensive, but blaming people is free.
Lecturing young men follows the exact same playbook. Explaining 24 consecutive months of decline in manufacturing and 25 consecutive months in construction requires overhauling industrial policy and vocational training systems. Blaming video games, on the other hand, can be done right at the dinner table tonight.
When I teach data courses, the very first question I ask my students is “What exactly does this number explain?” Observing male and female students in their 20s together in the classroom, it becomes clear that their anxieties stem from fundamentally different places. Young men feel the doorway itself has narrowed, while young women worry about whether they can last once they get inside. Both worries are valid. Yet when these two anxieties start blaming each other as the cause, those who narrowed the door and those who made staying unsustainable pay no price whatsoever.
Of course, let us acknowledge the counterargument. I do not believe the research premise that leisure technology affects labor supply is inherently wrong. It is indisputable that the quality of smartphones and video games today is vastly superior to that of 20 years ago. However, the magnitude of that effect must be discussed strictly within the bounds established by the original paper—and that bound is nowhere near large enough to justify labeling an entire generation lazy.
Closing
To summarize in three points: The 176,000-job reversal that made headlines in the US is a thin margin that could vanish with the August 28 statistical revisions, while the real signal lies in the 20-percentage-point decline in male labor force participation over 78 years. South Korea crossed this inflection point back in 2016, yet women continue to be pushed out in wages and job quality, while young men are locked out of entry altogether as manufacturing and construction contract. And while this structural shift gets boiled down into lectures that “young people just stay home playing video games,” the figures cited to justify that scolding look very different from what the original paper actually found.
So here are the only two indicators worth tracking moving forward: whether the US reversal holds after the August 28 benchmark revisions, and when South Korea sees its first month where manufacturing payrolls stop shrinking. Until that second number turns around, employment indicators for young men are unlikely to improve.
How does this look in your corner of the world, Reader? Where have you heard people complain that “kids these days have gotten lazy”—or conversely, where exactly do you feel pushed out? Share your thoughts in the comments. Feeling blocked at the door calls for a completely different solution than feeling unable to hold on. Once we gather enough stories, I’ll break them down by generation in an upcoming issue.
💬 Where have you heard the claim that “kids these days have gotten lazy”—or where have you personally felt pushed out? Let us know in the comments. 📨 If you have colleagues working in hiring or organizational leadership, please share this issue with them.
Keep the perspective, not the noise.
We choose one consequential shift and trace what sits beneath it, every other day.
Confirm once to finish subscribing.
References & Further Reading
Primary Sources
- Mary Julia Koch, “Young Men Are Abandoning the Workforce”, WSJ Free Expression, 2026. 8. Link ··· The starting point for today’s issue. The column where the 176,000 figure first caught widespread attention.
- Fortune, “The stay-at-home boyfriend is now an economic trend as more women than men go to work”, 2026. 8. Link ··· The source for the net decline of 142,000 men and the gain of 298,000 women. However, this coverage popularized the “70% gaming” soundbite, so compare that section against the paper below.
- Laura Ullrich, “How Women Have Closed the Workforce Gender Gap”, Indeed Hiring Lab, 2026. 3. Link ··· The primary analysis behind the recent reversal coverage. I recommend starting here rather than with the news summaries.
- TheStreet, “Women just claimed the majority of US jobs”, 2026. 8. 14. Link ··· The source noting that the August 28 benchmark revisions could eliminate this lead. A far more useful lens than popping champagne.
- Mark Aguiar, Mark Bils, Kerwin Kofi Charles & Erik Hurst, “Leisure Luxuries and the Labor Supply of Young Men”, Journal of Political Economy 129(2), 2021. Link ··· The original paper behind the “video games keep young men from working” narrative. The full NBER working paper is free to access; the Scrabble mention is in footnote 15.
- Korea Labor Institute, “2025 Labor Market Evaluation and 2026 Labor Market Outlook”, Employment and Labor Brief No. 114, 2025. 12. Link ··· The source for the assessment that “female employment remains solid while male employment continues to lag,” as well as the decline in manufacturing jobs for male junior college graduates.
- Korean Women’s Development Institute, “Key Characteristics and Implications of the Recent Female Labor Market”, 2025. 11. Link ··· The source for women aged 25–29 overtaking men at 74.5%, women aged 30–34 reaching 73.5%, and overall female employment reaching 62.1%.
Background
- Korean Women’s Development Institute, “Korean Women Earn 29.0% Less Monthly on Average Than Men”, 2025. 8. Link ··· Clear evidence that job counts and wage levels tell very different stories.
- Hankook Ilbo, “Relief in Career Breaks for Women in Their 30s Alongside Birth Aversion: The Hidden Truth of the M-Curve Statistics”, 2026. 1. Link ··· A breakdown of why a flattening M-curve should not be mistaken for the disappearance of discrimination.
- Korea Employment Information Service, “Characteristics and Transition Analysis of the Youth ‘Resting’ Population”, Employment Trends Brief No. 9, 2025. 12. Link ··· Source for the statistic that men make up 55.8% of the youth “resting” population.
- Financial News, “June Employed Up 63,000, Youth Employment Rate Falls for 26 Consecutive Months”, 2026. 7. 15. Link · National Manpower News, “Employed Decreasing for 45 Straight Months: A Structural Diagnosis of the 27-Month Fall in Youth Employment Rate”, 2026. 8. Link ··· These two reports detail the consecutive contractions in manufacturing and construction alongside the expansion in health and social welfare.
- Kyunghyang Shinmun, “Female Employment Rate in Late 20s Overtakes Male”, 2018. 4. Link ··· The first report covering Korea’s gender crossover. The Employment Information Service dated the shift to 2017, while the Women’s Development Institute dated it to 2016 due to differing baseline metrics.

📝 Glossary
Footnotes
-
Nonfarm payroll: A monthly employment metric compiled by the U.S. Bureau of Labor Statistics through an establishment survey. It excludes agriculture and the self-employed; an individual holding two payroll jobs is counted twice. ↩
-
Benchmark revision: An annual process reconciling sample-based monthly employment estimates with comprehensive administrative records, such as state unemployment insurance tax filings. Revisions can shift headline figures by hundreds of thousands of jobs. ↩
-
Labor force participation rate: The share of the working-age population that is either employed or actively seeking work. When discouraged workers stop job-hunting, they drop out of the unemployment rate, but this participation rate falls. ↩
-
M-curve: The dip in female employment rates during their 30s, creating an “M” shape across age cohorts. It reflects career interruptions caused by childbirth and early childcare. ↩
-
Expanded unemployment rate (Supplementary Employment Measure 3): A metric that adds job seekers preparing for work, discouraged workers, and involuntary part-time workers wanting more hours to the official unemployment count, offering a closer gauge of underemployment. ↩
-
“Resting” population (swieosseum): Individuals categorized under the economically inactive population who report simply “taking a break” without specific reasons like childcare, formal education, or illness. Though excluded from headline unemployment figures, they represent talent that has detached from the labor market. ↩
Related issues
Sober Chimpanzees, Solo Drinking in Korea
Soju got lighter and national drinking dropped, yet high-risk intake quietly surged among women in their 40s.
Why a 92% Productivity Score Gets You Flagged
Teams hitting 92% activity scores are the ones bosses suspect of gaming the system.
 Issue #222Society
Why a Kentucky Family Turned Down $26M for a Data Center
It wasn't the money that changed their minds—it was what they didn't know.
Your take shapes the next issue
What resonated most in this issue, or where has your experience been different?