

Sober Chimpanzees, Solo Drinking in Korea
Soju got lighter and national drinking dropped, yet high-risk intake quietly surged among women in their 40s.
Opening
Dear Reader, back in 2004, researchers on Barro Colorado Island in Panama observed a mantled howler monkey. It gorged on palm fruit for 20 minutes straight. When scientists analyzed the dropped fruit, they estimated the monkey had consumed the equivalent of 10 human standard drinks’ worth of alcohol. This single observation birthed the “drunken monkey hypothesis”—the idea that our modern taste for alcohol stems from our primate ancestors’ keen senses for sniffing out ripe fruit.
Yet over the past 20 years, the substance of this hypothesis quietly shifted, leaving only the catchy name behind.
South Korea is currently drinking less. The alcohol-by-volume of soju has dropped 8 times, and overall shipments continue to slide. Yet over the same period, high-risk drinking actually rose in one specific demographic. To give away the conclusion upfront: much of this apparent moderation is not a triumph of willpower, but a reallocation that occurred once the watchful eyes measuring our intake disappeared.
The Drunken Monkey Was Never Actually Drunk
Let’s unpack the hypothesis first. The 2004 picture was striking, but it leaned entirely on estimates from a single observation. As actual empirical measurements accumulated over the years, that picture underwent continuous revision.
In 2022, the first study directly measuring alcohol intake in wild primates was published. Analyzing the pulp of jobo fruit discarded by black-handed spider monkeys on that same Barro Colorado Island, researchers found ethanol concentrations hovering around 1–2%. The team also collected and tested the monkeys’ urine, finding ethyl glucuronide and ethyl sulfate1 in 5 of the 6 samples. This proved the animals were actively metabolizing alcohol. But the lead researcher’s takeaway was revealing: the monkeys weren’t eating the fruit to get drunk, but for the calories, because fermented fruit delivers higher energy.
In September 2025, an even more precise measurement emerged. A UC Berkeley research team analyzed 21 fruit species consumed by wild chimpanzees in Uganda’s Ngogo and Côte d’Ivoire’s Taï National Park. The average ethanol concentration in the fruit pulp was just 0.31–0.32% by weight—very low. Yet chimpanzees consume roughly 4.5kg of fruit a day. Do the math, and that translates to roughly 14g of pure ethanol, or 1.4 international standard drinks. Since a chimpanzee weighs around 40kg, adjusting for human body weight puts the intake at well over 2 standard drinks.
That amounts to drinking 2 drinks every single day. Yet not a single chimpanzee observed by the research team showed any signs of intoxication.
Genetic evidence was another piece missing from the 2004 narrative. A 2015 study revealed that a specific mutation in the alcohol-metabolizing enzyme ADH42 took root in our ancestral lineage around 10 million years ago, boosting alcohol metabolic efficiency by 40 times. The timing is telling: it coincided with the period when our ancestors came down from the trees to forage on the ground, where fallen fruit ferments far more aggressively than fruit still hanging on the branch.
Counterarguments exist, of course. A 2020 review pointed out the enormous variation in ethanol metabolic capacity across mammals, arguing that the popular notion of “animals getting drunk in the wild” is largely an exaggerated myth. In my view, this counterargument fits seamlessly with the updated hypothesis.
To sum up: evolution did not hand down a predisposition for getting drunk. What it gave us was an attraction to the scent of trace alcohol and a physiology capable of processing it without incident. The public image of the “drunken monkey” remains frozen in its 2004 version, frequently repurposed as an exonerating narrative: “Blame our ancestors for why we love drinking.” All the while, the science has sharpened in the exact opposite direction.
The wild has two natural ceilings
So how do chimpanzees consume the equivalent of two drinks a day without getting drunk? It is not a matter of willpower. The wild imposes two built-in ceilings.
The first is concentration. Yeast stops producing ethanol once the concentration reaches 10–15%. It effectively poisons itself on its own metabolic byproduct, so the level cannot rise any further. Furthermore, fruit hanging on a tree is only partially fermented, lingering at roughly 0.3–2% in reality. No matter how much a chimpanzee eats, getting drunk is physically out of reach.
The second ceiling is even more intriguing. In 2025, a study was published based on camera-trap footage from Cantanhez National Park in Guinea-Bissau, West Africa. It captured wild chimpanzees sharing fermented African breadfruit. The fruit’s ethanol concentration topped out at around 0.6%. That same year, another research team discussed this sharing behavior in connection with the evolutionary origins of human feasting rituals.
Let me draw an important distinction here. What these studies explicitly argue goes only as far as saying that fermented fruit is linked to social bonding. The idea that the act of sharing functions as a mechanism that caps individual intake is my own interpretation. Structurally, however, it is a natural inference. When a scarce resource is shared among many, there is far less opportunity for a single individual to binge.
Humanity dismantled the first of these two ceilings: distillation. Until distillation techniques that originated in Central Asia reached Europe in the Middle Ages, the alcoholic beverages humans consumed rarely exceeded 5%. But once distillation spread, liquids with 12%, 20%, and 40% alcohol entered everyday life. Senses calibrated over 40,000,000 years to 0.3% were suddenly confronted, in just a few centuries, with concentrations 100 times higher.
And now, in South Korea, the second ceiling is beginning to shift.
Why Are Indicators Diverging as Alcohol Content Falls?
Let’s look at the surface first. It is true that South Korea is drinking less. The numbers are unmistakable.
Domestic shipments of diluted soju dropped from 915,596 kL in pre-pandemic 2019 to 792,912 kL in 2025—a decline of roughly 13%. Beer shipments fell by 7.2% in 2025 alone. According to the Korea Health Promotion Institute, annual per capita consumption of domestic alcohol among people aged 15 and older fell 18%, from 8.4 liters in 2015 to 6.9 liters in 2023. Real household spending on alcohol has declined for 10 consecutive quarters, sliding to a monthly average of ₩13,000 (~$9.4) per household in Q1 2026.
Alcohol by volume (ABV) keeps falling, too. Chum-Churum was launched in 2006 at 20% ABV, but through 8 successive reductions, it came down to 16%. Saero lowered its ABV from 16% to 15.7% in January this year, and Chamisul matched it in June. The era of 15% soju has officially arrived. Meanwhile, the non-alcoholic and zero-proof beverage market is estimated to have expanded from roughly ₩20 billion (~$14.5 million) in 2021 to around ₩200 billion (~$145 million) in 2025.
An analysis of the 2025 Community Health Survey by the Korea Disease Control and Prevention Agency (KDCA) revealed that over the past decade, the high-risk drinking rate3 among men declined across all age groups. Men in their 20s saw their rate drop from 17.8% to 10.4%—a relative decrease of 41.6%. Men in their 30s recorded a 36.1% drop, from 25.5% to 16.3%. These were the demographics most directly affected by the decline of hoesik (after-work corporate drinking sessions).
For women, the trend moved in the opposite direction. Only women in their 20s saw a decrease, from 9.2% to 7.5%. Among women in their 30s, the rate climbed from 6.8% to 8.1%, and for those in their 40s, it rose from 5.8% to 7.6%. In fact, women in their 40s posted a 31.0% relative increase—the steepest rise of any demographic group across age and gender. Rates among women in their 50s, and 60s and older, also edged upward.
A statement from the KDCA National Health Information Portal captures the dynamic accurately: while aggregate alcohol consumption is declining, changing consumption patterns have caused high-risk drinking to rise within specific generations and genders. The agency identifies the proliferation of honsul (drinking alone) and homesul (drinking at home) as the primary behavioral drivers.
International comparisons make this divergence even clearer. In the OECD Health Statistics 2025 report, South Korea ranked 5th highest for monthly binge drinking among 27 comparable member countries based on 2023 data. Even as ABV levels drop and shipment volumes fall, Korea remains near the top of international binge-drinking rankings.
To be sure, some data points cut the other way. An early 2026 consumer survey reported that gatherings involving forced drinking accounted for just 2% of occasions, noting that solo and home drinking—which peaked during the pandemic—are shifting back outdoors. A 2025 survey by UnivTomorrow 20s Lab similarly found that 45.3% of respondents had drank alone in the past 3 months, roughly on par with drinking with friends (49.9%) or family (48.0%). However, that figure surged to 58.1% among unmarried single-person households.
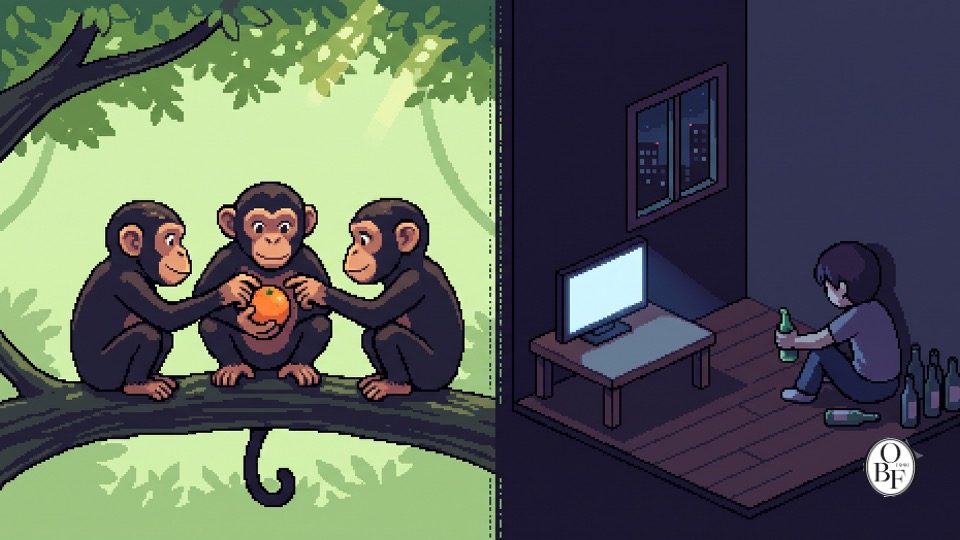
These two narratives may look contradictory, but I believe they describe the same reality from different angles. The core issue is not merely whether someone drinks alone. It is that nobody counts your glasses anymore. At a traditional corporate dinner, the person sitting next to you knew exactly how many drinks you had put away. That scrutiny was the source of coercive drinking, but it was also a mechanism of measurement. When the coercion disappeared, the measurement vanished with it. Whether drinking with close friends or entirely alone, you are now the only person who knows your total intake.
There is one more detail worth noting. Interpreting reductions in ABV purely as a response to consumer health preferences tells only half the story. Industry data shows that every 0.1% reduction in soju ABV cuts production costs by roughly ₩0.6 per 360 ml bottle. Neutral spirits represent the largest single cost item for major distillers, accounting for 35–46% of their raw material procurement spending. Health-conscious consumer trends and corporate margin defense happened to point in the exact same direction. Both factors are real, but corporate reductions in alcohol content should not be mistaken for society’s genuine commitment to sobriety.
Oswarld’s Lens
I do not see this structure as just a story about alcohol. I see it as a classic case of what happens when eliminating an institution also wipes out the secondary functions it was quietly performing.
During my consulting career, I helped with multiple organizational culture transformation projects. Scaling back hoesik (mandatory after-work drinking sessions) came up almost everywhere, and I largely agreed. Coerced drinking gatherings deserved to go. But looking at the execution plans, only one side of the ledger was ever calculated. What to eliminate was detailed meticulously, but what would replace the job the eliminated system had been doing was left blank.
The hoesik was a mechanism of coercion, but it was simultaneously a measurement device. How much a new hire drank, or which team leader was on the brink of burning out, became visible at that table. It was a terrible method, but things were visible nonetheless. Now, they are invisible. That is why, while drinking metrics quietly climbed among women in their 40s who lived largely outside the traditional hoesik culture, neither organizations nor society had any channel to detect it.
This pattern repeats itself verbatim in Go-to-Market (GTM) execution. The same thing happens when you scrap bad KPIs. Discarding a flawed metric is the right call, but the incidental visibility that metric provided vanishes along with it. Then, a few quarters later, the question inevitably returns: “Why didn’t anyone catch this?” The exact same thing happened during the shift to remote work. We dismantled the outdated mechanism of the daily commute, but most organizations designed nothing to replace the workload visibility it used to provide.
This is why I question the direction of alcohol moderation campaigns. Most messages target individual willpower. Yet the reason chimpanzees do not get drunk is not willpower—it is the 0.3% ceiling. Interventions that work for humans will likely follow a similar principle: ABV caps, mandatory labeling, restricted sales hours, and above all, mechanisms that make one’s own aggregate intake visible. Checking our bank balance every day while having no clue about our weekly alcohol consumption is the current default.
For context, the World Health Organization maintains that there is no safe level of alcohol consumption for health. It is also worth remembering that shifting to lower-ABV beverages does not guarantee a reduction in total alcohol consumed. A lower alcohol content simply makes it possible to drink longer and more often.
Closing
Let us sum up.
First, the drunken monkey hypothesis has kept its name while its substance has shifted. Wild chimpanzees consume the equivalent of over 2 drinks every day by human standards, yet they never get drunk. What evolution handed down to us was not a drive to get intoxicated, but a sensory attraction to trace amounts.
Second, moderation in the wild is not willpower; it is a hard ceiling: the concentration threshold where yeast halts on its own, and the social structure of sharing food. Humanity dismantled the first ceiling through distillation.
Third, South Korea’s total alcohol consumption is unmistakably declining. Yet while the metric for men in their 20s fell 41.6%, the figure for women in their 40s rose 31.0%. When drinking gatherings vanished, measurement disappeared with them.
I encourage you to try just 1 thing this week: count every drink you consumed over the past 1 week by the glass. Not the number of occasions, but the total drink count. If you cannot recall clearly, that is precisely the point of this piece.
Do you have a habit that actually grew after hoesik (after-work company dinners) declined? It does not have to be alcohol—food delivery, gaming, or short-form video all qualify. Tell me in the comments about any habit whose volume grew once it moved from spaces watched by others into solitary isolation. If enough stories gather, I will follow up in the next issue under the theme of “the vanished measuring device.”
💬 Share in the comments any habits that grew after hoesik declined. I will feature them in the next issue. 📨 If you have a colleague who has been talking about drinking habits lately, forward this piece their way.
Keep the perspective, not the noise.
We choose one consequential shift and trace what sits beneath it, every other day.
Confirm once to finish subscribing.
References & Further Reading
Primary sources
- Stephens, D. & Dudley, R., “The Drunken Monkey Hypothesis”, Natural History, December 2004 issue. ··· The starting point of this essay. Comparing the original paper from 20 years ago with more recent literature clearly illustrates how the hypothesis matured and sharpened.
- Maro, A., Sandel, A. A., Blaiore, B. Z. A., Wittig, R. M., Mitani, J. C. & Dudley, R., “Ethanol ingestion via frugivory in wild chimpanzees”, Science Advances, 2025. Link ··· The source for the 14g-per-day figure. The table detailing ethanol concentrations across 21 wild fruit species is the highlight.
- Campbell, C. J., Maro, A., Weaver, V. & Dudley, R., “Dietary ethanol ingestion by free-ranging spider monkeys (Ateles geoffroyi)”, Royal Society Open Science, 2022. Link ··· The first study to directly measure alcohol intake in wild primates. Start from the urinary metabolite detection section.
- Bowland, A. C. et al., “Wild chimpanzees share fermented fruits”, Current Biology, 2025. ··· The study that captured wild chimpanzees sharing fermented fruits on camera. Cited in this essay as evidence for the “second ceiling.”
- Janiak, M. C., Pinto, S. L., Duytschaever, G., Carrigan, M. A. & Melin, A. D., “Genetic evidence of widespread variation in ethanol metabolism among mammals: revisiting the ‘myth’ of natural intoxication”, Biology Letters, 2020. Link ··· The most compelling counterargument to the hypothesis. Read this alongside the rest for a balanced view.
- Korea Disease Control and Prevention Agency (KDCA), “Analysis of Drinking Indicators in the 2025 Community Health Survey,” July 2026. ··· Source for the 41.6% drop among men in their 20s and the 31.0% increase among women in their 40s.
- Korea Health Promotion Institute, 2025 Alcohol Statistics Compendium. ··· Compiles per capita alcohol consumption trends.
- National Tax Statistics (TASIS), Shipment Statistics by Alcoholic Beverage Type. Link ··· Primary data for soju and beer shipment volumes.
Background
- Dudley, R., The Drunken Monkey: Why We Drink and Abuse Alcohol, University of California Press, 2014. ··· A book written by the author of the hypothesis himself. At just 154 pages, it is an accessible read.
- Carrigan, M. A. et al., “Hominids adapted to metabolize ethanol long before human-directed fermentation”, PNAS, 2015. ··· The pivotal ADH4 mutation study. It explores the evolutionary significance of the 10-million-year timeline.
- OECD, Health at a Glance 2025. ··· Details international rankings for binge drinking rates, including South Korea’s.

📝 Glossary
Footnotes
-
Ethyl glucuronide / Ethyl sulfate: Byproducts left behind when the body metabolizes alcohol. Detecting these two substances in urine serves as direct biological proof that alcohol was consumed and processed. They are also standard biomarkers used in human alcohol testing. ↩
-
ADH4: One of several enzymes that break down alcohol. Located in the mouth, esophagus, and stomach, it is the very first enzyme alcohol encounters upon entering the body. Individual variation in ADH4 efficiency is one reason alcohol tolerance varies among people. ↩
-
High-risk drinking rate: The proportion of people who consume 7 or more drinks (for men) or 5 or more drinks (for women) in a single sitting more than 2 times a week. It is an official indicator tracked by the Korea Disease Control and Prevention Agency (KDCA), designed specifically to capture recurring heavy intake rather than occasional binge drinking. ↩
Related issues
Why a 92% Productivity Score Gets You Flagged
Teams hitting 92% activity scores are the ones bosses suspect of gaming the system.
 Issue #222Society
Why a Kentucky Family Turned Down $26M for a Data Center
It wasn't the money that changed their minds—it was what they didn't know.
 Issue #214Society
Why JD.com Is Giving Away Free Helmets
In India, they paid $2.60 an hour for this exact footage.
Your take shapes the next issue
What resonated most in this issue, or where has your experience been different?