

Spend $100 on AI Capex, Only $25 Reaches the GPU
I followed the other $75 all the way to where it actually goes.
BusinessErase Nvidia From the $100, and $75 Remains
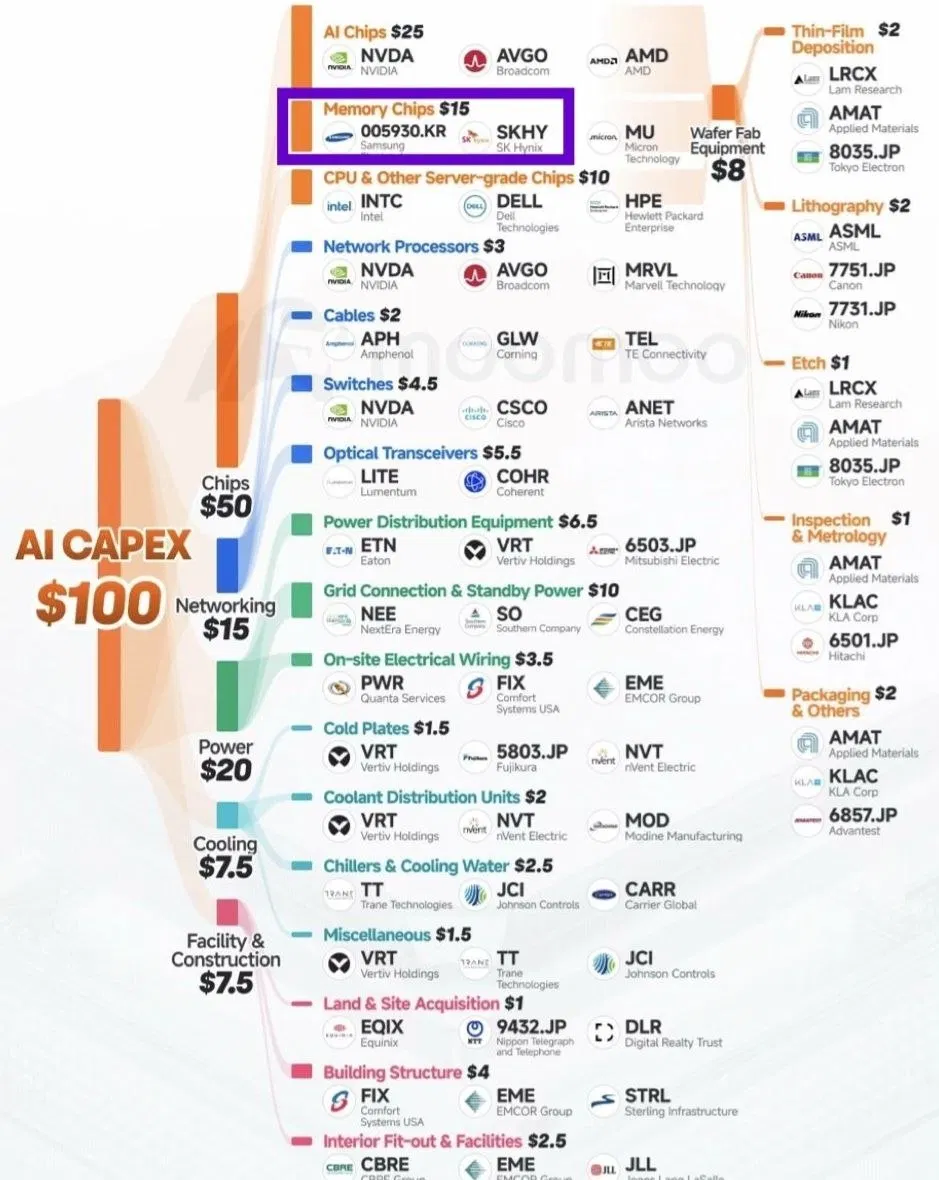
A single Sankey diagram1 tracing where every $100 of AI capex flows made the rounds in investment communities this week. On the left sits a bold bar labeled AI CAPEX $100; moving right, it splits into branches until roughly 60 company logos hang off the ends. The first branch catches your eye: $50 goes to chips, $25 of which goes to AI chips, with Nvidia, Broadcom, and AMD logos lined up side by side.
This issue walks through that $75, one box at a time. But walking alone just produces a map, and a map is only a summary. So I’ll carry one question along the way: of this $100, how much is still on the books five years from now? The answer up front: $65 disappears from the books within 5 years, while $35 lives for 30 years. And that difference determines which time horizon of the AI boom each company is standing on. This one should be very useful today.
The $100 Splits Into Five Branches
First, let’s set the record straight on the diagram’s source. The version circulating on social media carries a watermark from the trading app moomoo, but the original estimate is a model from BNP Paribas equity research. Let me also be clear about what this diagram does and doesn’t say. What it says is the sector-level allocation: $50 for chips, $20 for power, $15 for networking, $7.5 for cooling, $7.5 for facilities. What it doesn’t say is any per-company dollar figure. The logos attached to each box are just representative examples for that category — they don’t mean that specific dollar amount goes to that company. Just because Vertiv’s logo appears in 4 boxes doesn’t mean this data tells us how much of the $100 actually goes to Vertiv. Cross that line and you get sentences like “Samsung Electronics captures 7.5% of AI capex,” which is a misreading.
Now let’s walk through the five branches. First, one table for the full picture, then we’ll follow what’s happening inside each branch.
| Major branch | Amount | Sub-branch | Representative companies (per diagram) |
|---|---|---|---|
| Chips | $50 | AI chips $25 · Memory $15 · Server CPUs, etc. $10 | Nvidia, Broadcom, AMD / Samsung Electronics, SK Hynix, Micron / Intel, Dell, HPE |
| Networking | $15 | Network processors $3 · Cables $2 · Switches $4.5 · Optical transceivers $5.5 | Marvell, Amphenol, Corning, Cisco, Arista, Lumentum, Coherent |
| Power | $20 | Power distribution equipment $6.5 · Grid connection & backup power $10 · On-site electrical work $3.5 | Eaton, Vertiv, Mitsubishi Electric, NextEra, Southern, Constellation, Quanta Services |
| Cooling | $7.5 | Cold plates $1.5 · Coolant distribution units $2 · Chillers & coolant $2.5 · Other $1.5 | Vertiv, Fujikura, nVent, Modine, Trane, Johnson Controls, Carrier |
| Facilities | $7.5 | Land $1 · Building structure $4 · Interior systems $2.5 | Equinix, NTT, Digital Realty, Comfort Systems, EMCOR, CBRE, JLL |
Chips, $50: Three Kinds of Semiconductors and the Hidden $8 Behind Them
The $50 in chips splits three ways. The $25 for AI chips is accelerators — the GPUs and custom chips (ASICs) that actually run training and inference. Even within this $25, the structure is shifting. Broadcom sits next to Nvidia’s GPUs in the diagram because Broadcom designs and supplies custom chips like Google’s TPU. Amazon’s Trainium and Meta’s MTIA belong to the same trend. For hyperscalers, the surest way to shrink Nvidia’s slice of that $25 is to build their own chips, so a quiet shift keeps happening inside this branch.
The $15 in memory covers HBM2 and server DRAM — the parts that sit next to the accelerator and push data into it. Two Korean companies live here. It matters that the diagram draws memory as a separate branch from AI chips. In practice, HBM gets bundled into the GPU package itself — Nvidia buys it and assembles it in before selling. So on the hyperscaler’s invoice, the HBM price is buried inside the GPU price. BNP pulled it back out and drew it as its own branch, tracing where the money actually ends up.
The $10 for server CPUs and other chips is the share going to the general-purpose processors and finished servers needed to run GPU servers. In issue 217, I wrote that agents think with GPUs and work with CPUs — that CPU lives here. Intel and AMD’s server CPUs, along with server assemblers like Dell and HPE, live in this branch.
There’s one more branch in the diagram, an $8 offshoot splitting sideways from the chip branch: wafer fab equipment. Deposition $2, lithography $2, etching $1, inspection & metrology $1, packaging $2. This isn’t money hyperscalers spend directly — it represents secondary spending, where money the chip companies received flows back out into fab equipment. That’s why it’s drawn separately from the $100. ASML, Lam Research, Applied Materials, and Tokyo Electron live here. What makes this branch interesting is its lifespan. A GPU gets pushed out in 5 years, but the lithography machine that printed it runs for 20. In issue 54, I wrote that even with the blueprints, you couldn’t build ASML’s machines. That machine sits inside the $8 branching off the chip category, and it’s one of the longest-lived things in this entire $100.
You’ll Learn a Ton About Semiconductors. This One Will Stick With You Tonight. · Issue 54 · INLEVEL9Even with $165 billion invested, can the US replace Taiwan? I traced everything from wafers to assembly.Networking, $15: Where Copper Gives Way to Light
The $15 in networking is the cost of tying tens of thousands of GPUs together into a single computer. AI training isn’t a one-GPU job. Thousands, tens of thousands of GPUs have to constantly exchange computation results, and if that exchange is slow, even the most expensive GPU sits idle. So networking isn’t an accessory to the GPU — it’s a variable that determines the GPU’s actual performance. In Korea, this field is usually called optical communications.
The largest branch is optical transceivers3 at $5.5 — the parts that convert data traveling between server racks into light. Inside a single rack, copper wiring still does the job. One reason Nvidia’s GB200 NVL72 crams 72 GPUs into a single rack is to pack as many GPUs as possible within copper’s connectable range. But once you step outside the rack, copper can’t deliver the distance or the speed. From that point on, electrical signals need to be converted to light, and the transceiver is that converter. When GPU generations change and processing speeds rise, transceivers move to the next spec too. So this branch grows with every GPU sold, and gets swapped out whenever the GPU does. Lumentum and Coherent live here, and Nvidia’s 2025 announcement of co-packaged optics (CPO) — attaching optical components directly next to the chip — is itself a move to pull that $5.5 toward itself.
The $4.5 for switches is the equipment directing traffic between that light and electricity. Cisco and Arista are the traditional powerhouses, but it’s notable that Nvidia shows up in the switch box too. Nvidia is no longer just a GPU company — it now sells GPUs, switches, and cables as a bundled set. The $3 for network processors is the chip inside those switches, split between Marvell and Broadcom. The $2 for cables and connectors belongs to companies like Amphenol and Corning. It’s an unglamorous component, but a single AI data center lays down thousands of kilometers of optical cable.
Power, $20: Electricity Isn’t Bought, It’s Built
The $20 for power is the second-largest branch in this diagram — bigger than cooling and facilities combined at $15, and bigger than the $15 for networking. But this $20 isn’t your electricity bill. Electricity bills are operating expenses, so they don’t show up in a capex diagram. This $20 is the cost of the physical equipment needed to receive electricity and deliver it all the way to the chip.
Half of it, $10, goes to grid connection and backup power: substations, transmission lines, and self-generation equipment like gas turbines or fuel cells that produce the electricity the grid can’t supply. Looking at the scale explains why this branch has grown so large. A single 1GW data center draws as much power as one nuclear reactor. Connecting a facility like that to the US grid takes years just for the interconnection review, so hyperscalers have started buying or building power plants of their own. That’s why power utilities like NextEra, Southern, and Constellation appear in the diagram. In issue 189, I told the story of Google choosing a reactor design that had never been built before — that deal lives inside this $10. In issue 141, I wrote that ordering a single transformer takes 5 years — that transformer is here too. Gas turbines are so backed up that reports say GE, Siemens, and Mitsubishi Power’s combined production capacity is booked solid through 2030.
Data Centers Aren’t Stalling Because of Money or Chips · Issue 141 · INLEVEL9Not money, not chips — power is what’s bringing AI data centers to a halt.The $6.5 for power distribution equipment steps down and splits the high-voltage electricity entering the building into voltages the racks can actually use. Eaton, Vertiv, and Mitsubishi Electric live here. Vertiv was originally an uninterruptible power supply (UPS) company, but it shows up in 4 boxes in this diagram — it’s one of the few companies that sells both power distribution and cooling. The $3.5 for on-site electrical work is the labor and construction cost of actually laying and connecting that equipment. Names like Quanta Services, Comfort Systems, and EMCOR probably sound unfamiliar, but as AI data centers multiply across the US, electricians are the scarcest resource of all.
Cooling, $7.5: Where Air Gives Way to Water
The $7.5 for cooling is small in dollar terms, but its structure is in the middle of changing. Older data centers ran 10~15kW per server rack and cooled it with air. Today’s AI racks run 60~120kW. A single GB200 NVL72 rack draws around 120kW, and air can’t pull that heat out. So now there’s a metal plate on top of the chip with water running through it.
Of the four, the first two—the $1.5 cold plate and the $2 Coolant Distribution Unit (CDU)4—are the actual waterways. The cold plate is the metal plate that touches the chip directly, and the CDU is the pump system that sends coolant out to the cold plates across multiple racks and recovers the heated water afterward. These parts are installed with the rack and replaced with the rack. When a new GPU generation shifts where and how much heat gets generated, the cold plate has to be redesigned from scratch. Companies like Fujikura, nVent, and Modine live in this branch.
The latter two—the $2.5 chiller and cooling tower, and $1.5 in miscellaneous equipment—are building infrastructure. This is the gear that takes the hot water the CDU has recovered and sends it outside the building to cool down, and it belongs to HVAC companies like Trane, Johnson Controls, and Carrier. Once built, this stuff lasts for a long time. Inside the same cooling bay, you end up with parts that live 5 years alongside the rack mixed in with equipment that lives 20 years alongside the building. According to the construction cost index cited by the Epoch model, liquid-cooling designs push construction costs up 7-10% compared to air cooling. I’ll come back to this point in the lifespan table shortly.
Facilities, $7.5: The Building as a Box
Facilities at $7.5 make up the smallest branch. Land is $1, the building is $4, interior fit-out is $2.5. When you think “data center,” a massive building comes to mind first, but in dollar terms the building is less than a tenth of what goes inside it. This is the point where today’s data centers differ most from those of the past. Back when the business meant leasing out floor space for a handful of servers, the building was the center of cost. Now it’s been pushed down to the role of a box that holds expensive chips.
The $1 for land looks small, but regional variance is enormous. Loudoun, Virginia, or Santa Clara, California run $2.5-4.5 million per acre, while Ohio or Indiana run $100,000-300,000 per acre—a 15x gap. That’s why hyperscalers dodge expensive land and head for the middle of the country, and along the way run into scenes like the one from last month’s “Kentucky Mother-Daughter” issue: the landowners who turned down a ₩39 billion (~$28.9M) offer. The $4 for the building covers the floor and walls that bear the servers’ weight, while the $2.5 in interior fit-out covers finishing work like fire suppression, security, and under-floor wiring. Data center landlords like Equinix and Digital Realty, and real estate firms like CBRE and JLL, live on this branch.
The defining trait of this $7.5 branch is that it has the longest lifespan of all—15 to 30 years. It’s the thinnest branch in the diagram, and also the one that outlasts everything else.
Converting this $100 into actual dollar figures gives you a sense of scale. Add up the 2026 capex guidance from Amazon, Microsoft, Alphabet, and Meta and you get roughly $725 billion. That’s up 77% from roughly $410 billion in 2025, and Alphabet raised its own ceiling to $205 billion during its Q2 earnings call. Not all of this capex is AI spending, but most of it flows into AI data centers. Apply the diagram’s ratios directly to this $725 billion and you get roughly $180 billion for the AI chip branch, $109 billion for the memory branch, and $145 billion for the power branch. This is a derived figure—simply multiplying the BNP ratio by the combined capex of the four companies—so treat it as a sense of scale, not a precise breakdown.
Measure the same $100 with a different ruler, and power vanishes
Looking at that chart alone, power stands out clearly at $20. But when a different institution measures the same data center, the power line item disappears entirely. It isn’t gone — it’s just been folded into a different box.
Epoch AI modeled the cost structure of a 1GW-scale AI data center in May 2026. The assumptions: a US hyperscaler owns it directly, and every server is an Nvidia GB200 NVL72. Upfront capital expenditure comes out to $37.9 billion, broken down like this: servers $21.2 billion (56%), facilities $11.4 billion (30%), networking equipment $4.9 billion (13%), land $170 million, and substation equipment $160 million.
Set this side by side with the BNP Paribas chart, and three things jump out.
| Item | BNP Paribas (per $100) | Epoch AI (per $37.9B) |
|---|---|---|
| Chips/servers | 50 | 56 |
| Networking | 15 | 13 |
| Power | 20 | Included in facilities |
| Cooling | 7.5 | Included in facilities |
| Building/site | 7.5 | 30 (incl. power/cooling), plus ~1 for land/substation separately |
First, chips and networking are nearly identical across the two sources — 50 vs. 56, 15 vs. 13. However you measure it, IT equipment accounts for roughly two-thirds. Second, the $35 that BNP splits into power ($20), cooling ($7.5), and facilities ($7.5) shows up in Epoch’s model as a single $30 “facilities” line. That’s because Epoch uses a construction-cost index, and that index bundles a building’s electrical and mechanical systems into construction costs. Third, substation equipment comes to a mere 0.4% in Epoch’s model because it assumes grid power only — it doesn’t factor in on-site generation at all. The grid-interconnection-and-backup-power branch that BNP prices at $10 barely exists in Epoch’s version.
None of this means one source is wrong and the other right. In issue #181, I wrote that the $800 billion market-size figure swings in both directions depending on definition — and the same thing is happening here with cost structures. Whether power is 20% or 0% isn’t a fact about the data center changing; it’s a fact about which drawer the person holding the ruler decided to file electrical equipment in. So if you’re going to cite this chart and say “power is 20% of AI investment,” you need to attach the label: according to BNP’s classification.
But there’s one number where the two sources land exactly together. Epoch converted that $37.9 billion into an annual cost by spreading it across asset lifespans — 5 years for IT equipment, 14 years for facilities. Do that, and out of $8.5 billion in total annual cost of ownership, servers account for $5 billion — 60%. The 56% share servers held in upfront capex grows to 60% in annual cost. Facilities shrink in proportion. That 4-percentage-point gap is the center of this special issue.
$65 of Every $100 Vanishes From the Books Within 5 Years
Capital expenditure is spent all at once, but accounting spreads that money out as an expense over the life of the asset. This is called depreciation5, and how long you spread it over is called useful life. Here’s what the hyperscalers disclose as the useful life of their servers: Microsoft 6 years, Alphabet 6 years, Meta 5.5 years, Amazon 5 years. Starting in January 2025, Amazon cut the useful life on some of its servers from 6 years to 5. The reason given was that AI technology is changing so fast that servers now age faster than before. Meta moved the opposite direction, extending its useful life from 5 years to 5.5 years in 2025. On the same components, in the same period, one company shortened the clock and the other lengthened it.
Buildings and electrical equipment live on a completely different timescale. Data center buildings run 15 to 30 years, substations and transmission lines 30-plus years, and power generation equipment 20 to 40 years. Epoch’s assumption of 14 years for facilities follows this same convention. Let’s lay these two timescales over the BNP chart. If we regroup the $100 not by segment but by useful life, the picture changes like this:
| Lifespan | Amount | What’s included | Book value remaining after 5 years (approx.) |
|---|---|---|---|
| Short-lived assets (3–6 years) | $65 | AI chips $25 · Memory $15 · CPUs and servers $10 · Networking $15 | Close to $0 |
| Mid-life assets (5–15 years) | $3.5 | Cold plates $1.5 · CDUs $2 | Depends on rack replacement cycle |
| Long-lived assets (15–40 years) | $31.5 | Grid interconnection and power generation $10 · Power distribution $6.5 · Electrical work $3.5 · Chillers $2.5 · Other cooling $1.5 · Buildings $4 · Interior fit-out $2.5 · Land $1 | Around $25 remaining |
This table is my own derivative, reclassifying the BNP figures by useful life. Splitting the $7.5 in cooling between chip-attached components and building-level equipment is also my own judgment call. But the conclusion doesn’t budge even if you tweak the categorization a bit: roughly $65 of every $100 disappears from the books within 5 years, while roughly $30 stays on the books for another 20-plus years after that. This is also why, in Epoch’s numbers, servers grew from 56% of upfront investment to 60% of annual cost — the shorter the lifespan, the bigger the share you have to pay back every year.
What I want to point out here isn’t an accounting quirk. This gap in lifespans means the same AI capex chart actually contains two entirely different businesses.
The business behind the $65 in short-lived assets runs on a recurring-revenue structure. A GPU’s official life is 5 years, but in practice it’s pushed aside by the next generation within 3. Just to maintain existing AI capacity, hyperscalers have to spend that $65 again every 5 years — and if they want to add capacity, they have to spend more on top of that. That’s why Nvidia’s revenue reacts not to total capex but to the increase in capex, and why growth rates fall off a cliff the moment that increase stalls even for a single year. The same goes for memory, and the same goes for optical transceivers — when GPU generations change, transceiver specs change with them, forcing a simultaneous replacement. The upside of this business is that demand keeps coming back; the downside is that it stops the instant demand cools. Delay a replacement cycle by even 1 year, and that much revenue simply vanishes.
The business behind the $35 in long-lived assets runs on a one-time structure. Build a substation once, and it stands for 30 years — with no new orders in between. So companies in this business don’t see explosive revenue. What they do have is a long backlog. That’s why, in earnings releases from companies like Eaton, Vertiv, and Quanta Services, backlog gets mentioned before revenue. The upside of this business is that even if demand cools, orders already booked will carry the company for years; the downside is that even when demand picks back up, supply can’t scale quickly. A 5-year lead time on transformers is the proof.
Turning this recurring structure into numbers reveals a floor. The 4 major companies committed to spending roughly $410 billion in 2025 and roughly $725 billion in 2026. Apply the 65% short-lived-asset ratio to that, and over those two years roughly $740 billion worth of 5-year equipment goes into the ground. That equipment reaches end-of-life around 2030 and 2031. Even assuming AI demand hasn’t grown by a single step by then, just to maintain current capacity, roughly the same amount will have to be spent again at that point. This is replacement demand that occurs with zero growth — the minimum floor that chip, memory, and transceiver companies can count on 5 years from now. Of course, this is a derivative calculation applying the BNP ratio and a 5-year useful life to combined guidance figures, so treat it as directional only. But the mere existence of this floor explains why the short-lived-asset business never fully shuts down even when the boom cools.
The two businesses experience an AI demand downturn in completely different ways. On the chip side, orders drop from the very first quarter. On the power side, a substation already under construction can’t be stopped, so momentum continues for 2 to 3 years regardless. The reverse is also true: when demand picks back up, the chip side reacts the next quarter, while the power side reacts 5 years later. So underneath the single phrase “AI infrastructure beneficiary” sit two clocks ticking at 20 times different speeds.
Korea Sits in the $15 Box — and in the $20 Box the Chart Leaves Out
Now let’s look at the chart again, this time from Korea’s vantage point. The Korean companies that jump out are Samsung Electronics and SK hynix. Both sit in the $15 memory box. In the $85 box covering networking, power, cooling, and facilities, there isn’t a single Korean name. Going by the chart alone, Korea looks like a country holding a 15% seat in AI capex.
Let’s be precise about what that seat actually is. The $15 memory box, as the earlier table showed, sits on the short-lived-asset side. It’s recurring demand that cycles back every 5 years — and in practice even faster, since HBM generations turn over every time GPU generations do. It sits right next to the $25 AI-chip box and moves on the same clock. That’s a good seat. But the reason it’s good and the reason it’s risky are the same reason. If hyperscalers merely pause capex growth for a single year, this box wobbles in that same quarter. In issue #219 I wrote that memory is the next battlefield for AI semiconductors; what this chart adds is the information that the battlefield sits on top of recurring demand. In issue #183 I covered how SanDisk extracted 4-year supply commitments from its customers. The meaning of that commitment reads differently here. In a short-lived-asset business, a long-term contract is an attempt to pin recurring demand down as if it were a long-lived asset. That’s exactly why memory makers cling so hard to multi-year deals with hyperscalers.
But there’s one more Korean name missing from the chart. It’s the $20 power box. HD Hyundai Electric is the No. 1 transformer maker in North America, and on July 6, 2026 it raised its annual order target from $4.222 billion to $5.185 billion — up 22.8% — citing North American AI data center investment and demand for replacing aging power grids. Its order backlog at the end of Q2 stood at $8.49 billion. It’s building a second plant in Alabama, and once the expansion of its existing plant finishes in April 2027, its power transformer production capacity will rise 50%. Hyosung Heavy Industries has expanded its Memphis, Tennessee plant three times and has broken into a market once oligopolized by a handful of firms with its high-voltage direct current (HVDC) technology. As of 2025, operating profit at Hyosung Heavy Industries, HD Hyundai Electric, and Iljin Electric rose 122%, 49%, and 90% year-over-year, respectively.
The fact that the BNP chart drew Eaton, Mitsubishi Electric, and NextEra into the power box while leaving Korean companies out is simply a limitation of the chart. It picked a few representative examples and left others out — it doesn’t mean the money isn’t flowing there. So Korea actually occupies two seats: the $15 short-lived-asset box, and the $20 long-lived-asset box.
These two seats run on different clocks. Memory moves quarter by quarter, with margins swinging widely. Transformers carry a backlog stacked 2 to 3 years deep, take 2 years to expand capacity for, and once sold, see no reorder for 30 years. That means the two sectors that rallied together in the Korean stock market in H1 2026 under the same banner of “AI plays” are, in fact, businesses of opposite character. In issue #209, I wrote that 92% of buying in SK hynix leveraged ETFs came from retail investors. What that money is buying isn’t “AI exposure” — it’s the volatility of 5-year recurring demand. Had the same money gone into a transformer maker instead, it would have bought a backlog of 30-year one-time orders. This isn’t a claim that one is better than the other. It’s a claim that they’re different products.
If you’ve read this far, the next time you hear the phrase “AI infrastructure beneficiary stock” or “AI-beneficiary industry,” you can ask three questions.
- Which box out of the $100 does the company sit in? Whether it’s the $25 AI-chip box, the $5.5 optical-transceiver box, or the $1 site box, the market size differs by a factor of 25.
- How many years is the asset life of that box? 5 years means recurring demand and sharp swings; 30 years means one-time demand and a long backlog.
- Is the bottleneck in that box supply or demand? With a 5-year lead time like transformers, revenue keeps flowing for a while even if demand cools; with supply that loosens up like GPUs, any shift in demand shows up in earnings immediately.
Any stock recommendation that can’t answer these three questions is talk made without ever looking at the chart. For the record, this piece isn’t recommending that you buy or sell any specific stock or product. Investment decisions and their consequences are your own responsibility, and the figures here reflect values confirmed via disclosures and news reports at the time of writing — they may have since changed.
Oswarld’s Lens
The first time I looked at this chart, I read it as “who’s making the money.” The second time, I saw “who’s standing on which timeline.” The second reading is more useful. Where the money flows shifts every quarter, but the lifespan of an asset doesn’t change until the underlying technology does.
You can revisit the AI bubble debate through this same lens. When people say the bubble is popping, they’re usually talking about the $65 side of the ledger — not buying the next generation of GPUs, delaying memory orders, skipping transceiver upgrades. That can happen fast, and it can knock a quarter’s worth of revenue out from under those companies. But the $35 side is a different story. The substations that got built, the transmission lines that got laid, the buildings that got erected — those survive even after the bubble bursts. In issue 192, I wrote about Britain’s railway bubble of the 1840s. The railway companies’ stock disappeared, but the rails stayed, and the next generation built its business on top of them. The $35 in AI capital expenditure is that rail line.
So I hear the question “is AI investment excessive?” as two separate questions. Whether the $65 is excessive depends on whether current-generation GPUs are enough for the next generation of models. Whether the $35 is excessive depends on whether that electricity and those buildings can be put to uses beyond AI. The answers to these two questions can diverge. As I see it, the biggest misreading happening in the Korean market right now is the habit of lumping both of these together under a single word.
Closing
This issue, I read one chart three times. The first pass was by segment: of every $100, chips take $50, power $20, networking $15, cooling $7.5, and facilities $7.5. The second pass used a different institution’s ruler, and it showed that the $20 in power can hide inside “facilities” depending on which classification you use. The third pass was by lifespan: $65 disappears within 5 years, while $35 lives for 30. Korea has a seat in each of those two timeframes, and while the two seats share a name, they’re in different businesses.
Look at the chart again, and now you’ll notice the thickness of the branches before the logos, and the lifespan of each branch before the thickness. Remember that $75 remains even if you cover up Nvidia, and you’ll understand where three-quarters of AI news actually comes from. It also shows that of that $75, the money that lasts longest goes to the quietest companies. The next time you hear an AI infrastructure story, just ask three questions: which box is that company in, how many years does the equipment in that box last, and is that box’s bottleneck on the supply side or the demand side? If you get answers, that’s a story that has looked at the chart. If you don’t, it’s a story that has only looked at the logo.
💬 Where does the company you work for, or one you’re interested in, sit on this chart? Leave a comment with the name of the box and roughly how many years that box’s assets last. Feel free to dig up more Korean names that aren’t on the chart yet.
📨 If you have a colleague who lumps every AI-related stock together as a single “beneficiary stock,” pass this piece along to them.
Looking at the fragment, I found one issue: “Hans Kyungjae” should be romanized more accurately as it appears to be a media outlet name (Hans Kyungjae). Let me check the rest for accuracy against the Korean source.
Everything else matches well — numbers, links, headings, and footnotes align correctly with zero Hangul remaining.
Keep the perspective, not the noise.
We choose one consequential shift and trace what sits beneath it, every other day.
Confirm once to finish subscribing.
Already a subscriber? Sign in to join the conversation
References & Further Reading
Primary sources
- BNP Paribas Equity Research estimates, chart by SankeyMATIC, “How $100 in AI Infrastructure Spending Breaks Down” (reconstructed by cloudnews.tech), September 3, 2026. Link ··· A write-up organizing the original source and category-by-category figures behind the Sankey diagram this issue examines. The moomoo version is a reworking of this same estimate.
- Amelia Michael, Ben Cottier, “Servers account for 60% of the total cost of ownership of a one-gigawatt AI data center”, Epoch AI, May 14, 2026. Link ··· A cost model for a 1GW data center. It publishes the breakdown of the $37.9 billion upfront investment, the annualization method, and the assumptions and limitations in an open spreadsheet, making it easy to check against the BNP chart.
- Yahoo Finance, “Meta, Microsoft, Amazon, and Alphabet are about to spend a shocking amount of money to dominate the AI era”, June 3, 2026. Link ··· Covers the four companies’ combined $725 billion in 2026 capex and Goldman Sachs’s cumulative forecast through 2030.
- Financial News (via Daum), “‘North America’s No. 1 in transformers’ HD Hyundai Electric raises this year’s order target by 23%”, July 6, 2026. Link ··· A correction filing reporting the order target raised from $4.222 billion to $5.185 billion.
- Hanskyung (via Daum), “HD Hyundai Electric’s next growth engine is ‘data centers’”, August 4, 2026. Link ··· Summarizes Q2 earnings, an order backlog of $8.49 billion, and the risk of overconcentration in North America.
- Dailian, “‘We’ll cover the tariffs’… HD Hyundai Electric and Hyosung Heavy Industries have buyers lining up in the US too”. Link ··· Includes brokerage analysis noting that lead times for ultra-high-voltage transformers have stretched to as long as 5 years.
Background
- Global Data Center Hub, “What a Data Center Actually Costs: CapEx Breakdown and the Drivers That Move It”, September 2026. Link ··· A practitioner’s view on the depreciation gap between buildings (15–30 years) and servers (3–5 years), and the structure of construction cost per MW.
- Dealsite, “Hyosung Heavy Industries, HD Hyundai Electric, LS Electric, and Iljin Electric 2025 earnings”. Link ··· The source for the 2025 operating profit growth rates of Korea’s four major power equipment makers.
Related past issues
- You Thought You Just Needed to Buy GPUs? The Real Battleground of the AI Infrastructure War ··· Issue 17. The first issue to lay out the three axes of chips, power, and memory.
- Data Centers Aren’t Stalling Because of Money or Chips ··· Issue 141. A ground-level look at the 5-year transformer lead time.
- $800 Billion, the World’s Most Famous Wrong Number ··· Issue 181. A story about how numbers change when definitions change.
- The Next Battlefield in AI Chips Is Memory ··· Issue 219. The internal structure behind the $15 memory slice.

📝 Glossary
Footnotes
-
Sankey diagram: A chart that represents the size of a flow through the thickness of a line. A total quantity on the left splits into several branches moving right, with each branch’s thickness representing its share. Commonly used to depict energy flows or budget allocations. ↩
-
HBM (High Bandwidth Memory): Memory made by stacking DRAM chips in multiple layers and placing them right next to the GPU. It moves data through far wider channels than ordinary memory, making it an essential component of AI accelerators. It’s made by three companies: Samsung Electronics, SK Hynix, and Micron. ↩
-
Optical transceiver: A component that converts electrical signals into light to send over optical cable, and converts received light back into electrical signals. Used inside data centers to connect server racks to switches; when GPU generations change, the required speed rises and transceivers get swapped out along with them. ↩
-
CDU (Coolant Distribution Unit): A device that sends coolant to the cold plates attached to chips and recovers the heated water, passing it on to the building’s cooling systems. In liquid-cooled data centers, it acts as the intermediary between the rack and the building’s facilities. ↩
-
Depreciation and useful life: Depreciation is the accounting method of spreading the cost of equipment over its period of use rather than expensing it all at once; that period of use is called its useful life. Extending the useful life lowers the expense recognized each year, which raises that year’s profit. ↩


Related issues
The Company That Asks Marketers 'What Did You Build?'
What's vanishing isn't jobs—it's the old bar for getting hired in the first place.
BusinessFrance Bans Cold Calls as Korea Doubles Down
By shifting from opt-out registries to strict prior consent, the economics of outbound sales lists have been fundamentally reset.
BusinessNYC Banned AI in Schools. Korea's Screens Are on the Table
Banning AI in classrooms will not reach the screens Korean parents rely on for everyday childcare.
Business
Your take shapes the next issue
What resonated most in this issue, or where has your experience been different?