Why the Pentagon Pizza Theory Didn't Hold Up
The more seductive a hypothesis feels, the sharper your scrutiny needs to be.
Opening
Would you believe you could predict a war from pizza orders?
On the night of August 1, 1990, Frank Meeks, a Domino’s Pizza franchise owner in Washington, D.C., noticed something strange. Twenty-one pizzas had been delivered to the CIA building in the middle of the night. The next morning, Iraq invaded Kuwait. The Gulf War had begun. Meeks initially chalked it up to coincidence — but he’d seen the same pattern the night before the 1983 invasion of Grenada, and again before the 1989 invasion of Panama.
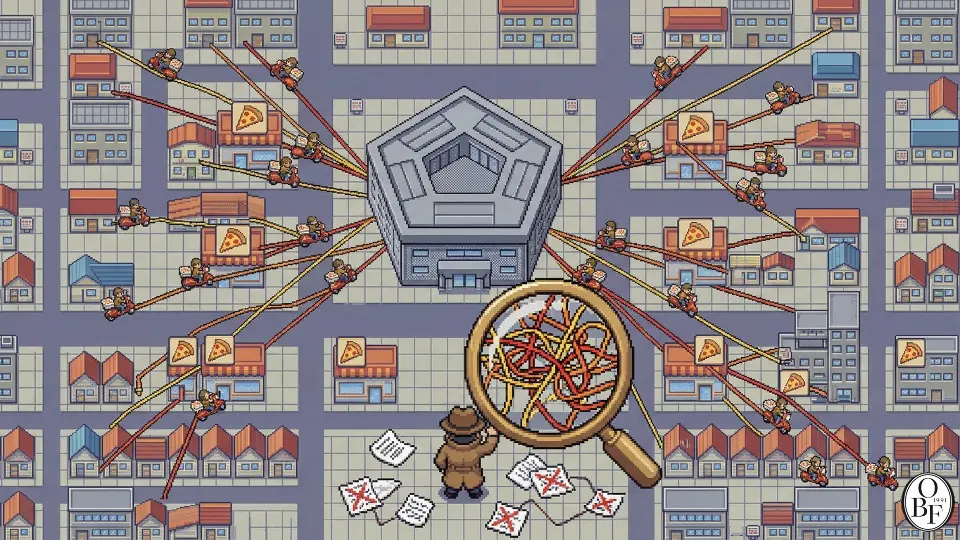
This became known as the “Pentagon Pizza Theory.” The idea: when roughly 30,000 employees at the Pentagon (the U.S. Department of Defense) settle in for a night of overtime, pizza sales at nearby shops spike — and if you can read that signal, you can predict military operations. This urban legend has survived for over 30 years, resurfacing in coverage of recent operations in Venezuela and Iran. Data scientists recently decided to actually test it. The results were surprising.
Reading War Through Pizza — The Theory’s Structure
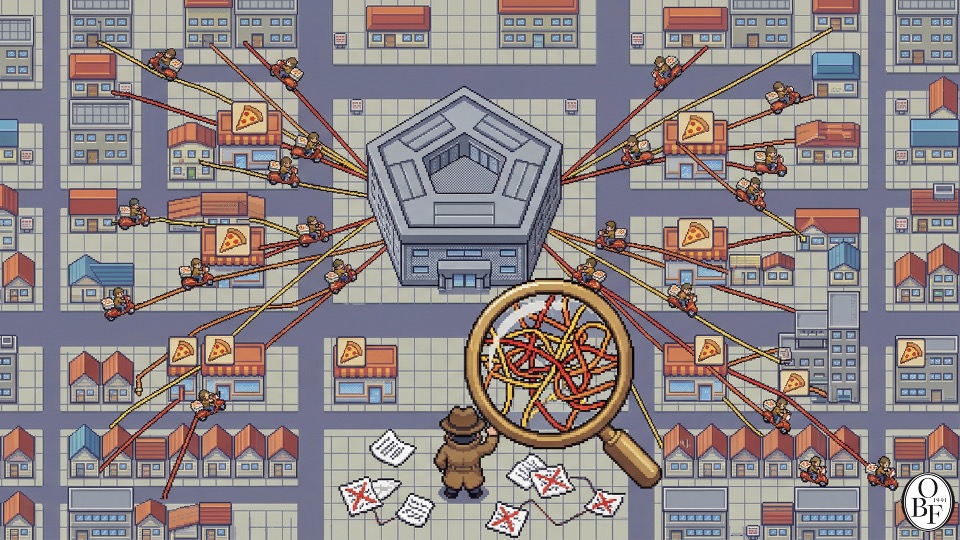
The logic of the Pentagon Pizza Theory is intuitive.
When a national security crisis breaks out, Pentagon staff pull all-nighters. Unable to leave the building, they order food delivery — and for Americans, pizza is the most universal delivery food. So a surge in sales at pizzerias near the Pentagon becomes a proxy indicator1 for rising military tension.
This theory hasn’t stayed a mere joke for a reason. When Iran launched drones at Israel in April 2024, and again right before Israel’s June 2025 strike on Iranian nuclear facilities, Google Maps’ real-time “popular times” data showed spikes in activity at pizzerias around the Pentagon. The X (formerly Twitter) account @PenPizzaReport tracked this in real time and amassed over 300,000 followers. The prediction market platform Polymarket even turned it into an official indicator.
But the intellectual roots of this theory run deeper than you’d expect. It didn’t start with pizza — it started with lithium.
The Man Who Read a Nuclear Bomb Off a Stock Chart — Armen Alchian and the Birth of the Event Study
In 1954, economist Armen Alchian, working at the American think tank RAND Corporation, grew curious about one thing: what fusion fuel was the United States using in the hydrogen bomb it was developing?
Naturally, this was top secret. Asking RAND’s own physicists would have gotten him nowhere. Alchian found another way in. He pulled a list of publicly traded companies producing candidate fusion fuels — thorium, thallium, beryllium, lithium — from a U.S. Department of Commerce yearbook, and tracked their stock prices for 6 months.
The result was striking. While 4-5 companies’ stock prices stayed mostly flat, one — Lithium Corporation of America — shot up from around $2 to around $13. Alchian wrote up his findings in a memo titled “The Stock Market Speaks” and circulated it internally.
2 days later, he was summoned by RAND’s director. “Armen, this needs to be suppressed.” The paper was confiscated and destroyed — deemed a threat to national security.
This was the world’s first event study2 — 15 years before Eugene Fama’s 1969 research on stock splits. The idea that you could infer classified information purely from public data, and that it actually worked — that’s the intellectual lineage of the Pentagon Pizza Theory. It’s a methodology for finding hidden patterns by linking specific events to observable indicators.
The Data’s Verdict — The Pizza Theory Didn’t Work
So what did data scientists, as Alchian’s intellectual heirs, find in 2025?
The core of the analysis was this: they collected the pizzeria activity data accumulated by @PenPizzaReport on X, and compared it against the actual timing of military operations. 3 events were tested:
- January 2025: the operation to capture Venezuelan President Maduro
- March 2025: the strike on Houthi rebels in the Red Sea
- June 2025: the bombing of Iranian nuclear facilities
Here, the analysts added a clever twist. They used activity data from Freddie’s Beach Bar & Restaurant, a gay bar near the Pentagon, as a control variable3. The logic: if pizzerias were getting busier because of overtime work, a bar in the same neighborhood shouldn’t be affected. But if the cause were something external — weather, a local event — both the pizzeria and the bar should get busier together. Subtracting Freddie’s activity from the pizzerias’ activity should isolate the “pure late-night-pizza effect.”
The result?
No correlation whatsoever.
At the exact moment of the Maduro capture operation, the “Freddie-adjusted pizza activity index” was actually at its lowest point. Same story with the strike on Iran’s nuclear facilities. If the theory held, the pizza index should have spiked right before each operation. It didn’t — not even close.
Oz’s Lens
Honestly, I wasn’t surprised by this result.
Having taught and practiced data analysis myself, I could see a few structural weaknesses in the Pentagon Pizza Theory from the start.
First, there’s a measurement problem. What @PenPizzaReport tracks is Google Maps’ “real-time popular times” data — which measures the number of smartphones inside a store, not pizza orders. Pentagon staff in a crisis aren’t rushing out to stand in line at a pizzeria — they’re ordering delivery through an app, which this method simply doesn’t capture.
Second, the times have changed. The U.S. Department of Defense does remote work too. In an era when the U.S. government is the top customer of companies like Palantir, assuming that all crisis response happens exclusively inside the Pentagon building is a 1990s way of thinking.
Third — and most importantly — the Pentagon’s own official spokesperson has already addressed this: “There are restaurants inside the Pentagon that sell pizza, sushi, sandwiches, donuts, and coffee.” Defense Secretary Pete Hegseth went even further, joking that he’d “order a ton of pizza every Friday night just to throw off the trackers.”
But I’m not covering this story to “debunk an urban legend.”
The real value lies in the verification process itself. When you encounter an appealing hypothesis, the discipline of not simply taking it at face value — instead setting control variables, cleaning the data, and distinguishing correlation from causation — that’s the distilled essence of 70 years of event-study methodology since Alchian. And now that large language models have driven down the cost of writing code, far more people can actually run this kind of verification themselves. I think that shift matters more than the debunking itself.
Closing
To sum up:
The Pentagon Pizza Theory had a clear intellectual pedigree, but it didn’t hold up against the data. And that conclusion — that it “didn’t work” — is valuable knowledge in its own right. Alchian inferring nuclear fuel from stock prices, and data scientists trying to predict military operations from pizzeria sales, are two experiments in the same methodology. One succeeded. One failed. What matters is that both were attempted.
The next time someone tells you “this data clearly shows a trend,” try asking: “What was your control variable?” That one question will level up your data literacy.
This is also the single thing I emphasize most when teaching data-related courses at university.
References & Further Reading
- “Does Pentagon Pizza Theory Work?”, LessWrong: The original analysis using Freddie’s Beach Bar as a control variable. Today’s core data comes from here.
- Joseph Michael Newhard, “The Stock Market Speaks: How Dr. Alchian Learned to Build the Bomb”, Journal of Corporate Finance, Vol. 27, 2014.: An academic study reconstructing Alchian’s destroyed paper. Essential reading for understanding the history of the event study.
- “Pentagon pizza theory”, Wikipedia.: A well-organized chronology of cases from 1983 through 2026.
- “Did Busy Pizza Shops Really Predict US Airstrikes on Iran?”, Washingtonian, 2025.: Covers how Google Maps’ “popular times” data works and offers an OSINT-focused analysis. https://washingtonian.com/2025/06/26/did-busy-pizza-shops-really-predict-us-airstrikes-on-iran/
- Marcel Plichta, “The Pentagon Pizza Index is a Nonsense Indicator”, LinkedIn, 2025.: A former U.S. Defense Department analyst breaks down the indicator’s structural flaws. https://www.linkedin.com/pulse/pentagon-pizza-index-nonsense-indicator-heres-how-do-better-plichta-4z6te

The author, Kwangseob Ahn, is a professor of business administration at Sejong University and lead consultant at OBF (Oswarld Boutique Consulting Firm). He teaches statistics and data analysis — business data management and business analytics — while leading GTM and AI strategy consulting in the field, designing the seam between technology and business. He has published academic research on a memory architecture for AI dialogue systems (HEMA) and runs Daily Arxiv, a daily curation of global AI papers. He holds a master’s from Korea University’s Graduate School of Technology Management and a KMBA. He is the author of Homo Brainless: The People Who Outsource Their Thinking.
Footnotes
-
Proxy Indicator: An indirect measure standing in for a phenomenon that’s hard to observe directly. It’s the same principle as estimating a country’s economic vitality from “the brightness of its nighttime satellite images.” ↩
-
Event Study: A statistical method for analyzing how a related indicator (stock price, sales, etc.) changes when a specific event occurs. Widely used in finance and economics to test whether an event actually had an effect. ↩
-
Control Variable: A comparison baseline held constant across “other conditions” so you can isolate a pure effect in an experiment. In this analysis, Freddie’s Bar served as the control variable, filtering out the influence of external factors like weather or local events. ↩
Related issues
 Issue #13Society
Orwell's 1946 Warning on Language and Thought
Clear language isn't the result of clear thinking — it's the precondition for it
 Issue #5Society
Jensen Huang Never Did 'Self-Development.' He Just Worked.
Ask any successful person for their secret, and you'll always get the same answer: "I just did it."
 Issue #4Society
In the AI Era, Cultivate Taste, Not Skills
Technology creates dependence, but taste becomes an asset nothing can replace.
Your take shapes the next issue
What resonated most in this issue, or where has your experience been different?